注意
转到末尾以下载完整示例代码或通过 JupyterLite 或 Binder 在浏览器中运行此示例。
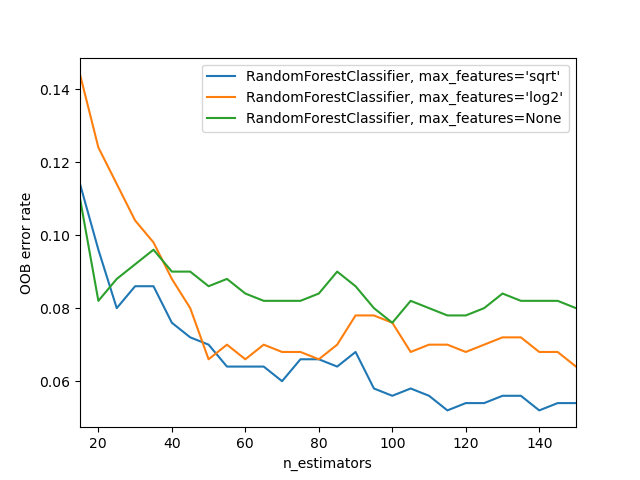
随机森林的 OOB 误差#
RandomForestClassifier 使用 bootstrap aggregation 进行训练,其中每棵新树都是根据训练观测值 \(z_i = (x_i, y_i)\) 的 bootstrap 样本拟合的。 Out-of-bag (OOB) 误差是针对每个 \(z_i\) 计算的平均误差,使用来自其各自 bootstrap 样本中不包含 \(z_i\) 的树的预测。这使得 RandomForestClassifier 可以在训练的同时进行拟合和验证 [1]。
下面的示例演示了如何在训练期间添加每棵新树时测量 OOB 误差。由此产生的图表允许实践者近似确定一个合适的 n_estimators 值,在该值处误差趋于稳定。
# Authors: The scikit-learn developers
# SPDX-License-Identifier: BSD-3-Clause

from collections import OrderedDict

import matplotlib.pyplot as plt

from sklearn.datasets import make_classification
from sklearn.ensemble import RandomForestClassifier

RANDOM_STATE = 123

# Generate a binary classification dataset.
X, y = make_classification(
    n_samples=500,
    n_features=25,
    n_clusters_per_class=1,
    n_informative=15,
    random_state=RANDOM_STATE,
)

# NOTE: Setting the `warm_start` construction parameter to `True` disables
# support for parallelized ensembles but is necessary for tracking the OOB
# error trajectory during training.
ensemble_clfs = [
    (
        "RandomForestClassifier, max_features='sqrt'",
        RandomForestClassifier(
            warm_start=True,
            oob_score=True,
            max_features="sqrt",
            random_state=RANDOM_STATE,
        ),
    ),
    (
        "RandomForestClassifier, max_features='log2'",
        RandomForestClassifier(
            warm_start=True,
            max_features="log2",
            oob_score=True,
            random_state=RANDOM_STATE,
        ),
    ),
    (
        "RandomForestClassifier, max_features=None",
        RandomForestClassifier(
            warm_start=True,
            max_features=None,
            oob_score=True,
            random_state=RANDOM_STATE,
        ),
    ),
]

# Map a classifier name to a list of (<n_estimators>, <error rate>) pairs.
error_rate = OrderedDict((label, []) for label, _ in ensemble_clfs)

# Range of `n_estimators` values to explore.
min_estimators = 15
max_estimators = 150

for label, clf in ensemble_clfs:
    for i in range(min_estimators, max_estimators + 1, 5):
        clf.set_params(n_estimators=i)
        clf.fit(X, y)

        # Record the OOB error for each `n_estimators=i` setting.
        oob_error = 1 - clf.oob_score_
        error_rate[label].append((i, oob_error))

# Generate the "OOB error rate" vs. "n_estimators" plot.
for label, clf_err in error_rate.items():
    xs, ys = zip(*clf_err)
    plt.plot(xs, ys, label=label)

plt.xlim(min_estimators, max_estimators)
plt.xlabel("n_estimators")
plt.ylabel("OOB error rate")
plt.legend(loc="upper right")
plt.show()
脚本总运行时间: (0 minutes 3.264 seconds)
相关示例