DET曲线#
- sklearn.metrics.det_curve(y_true, y_score, pos_label=None, sample_weight=None)[source]#
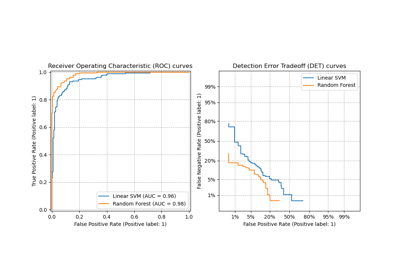
计算不同概率阈值下的错误率。
注意
此指标用于评估二元分类任务的排序和错误权衡。
更多信息请阅读用户指南。
0.24 版本新增。
- 参数:
- y_truendarray of shape (n_samples,)
真实的二元标签。如果标签不是 {-1, 1} 或 {0, 1},则应明确给出 pos_label。
- y_scorendarray of shape of (n_samples,)
目标分数,可以是正类的概率估计、置信度值或非阈值决策度量(某些分类器返回的“decision_function”)。
- pos_labelint, float, bool 或 str, default=None
正类的标签。当
pos_label=None时,如果y_true为 {-1, 1} 或 {0, 1},则pos_label设置为 1,否则将引发错误。- sample_weightarray-like of shape (n_samples,), default=None
样本权重。
- 返回值:
- fprndarray of shape (n_thresholds,)
假阳性率 (FPR),其中元素 i 是分数 >= thresholds[i] 的预测的假阳性率。这有时被称为假接受概率或漏报率。
- fnrndarray of shape (n_thresholds,)
假阴性率 (FNR),其中元素 i 是分数 >= thresholds[i] 的预测的假阴性率。这有时被称为假拒绝率或失误率。
- thresholdsndarray of shape (n_thresholds,)
递减的分数值。
参见
DetCurveDisplay.from_estimator给定估计器和一些数据绘制 DET 曲线。
DetCurveDisplay.from_predictions给定真实和预测标签绘制 DET 曲线。
DET曲线显示 (DetCurveDisplay)DET 曲线可视化。
ROC曲线 (roc_curve)计算接收者操作特征 (ROC) 曲线。
精确率-召回率曲线 (precision_recall_curve)计算精确率-召回率曲线。
示例
>>> import numpy as np
>>> from sklearn.metrics import det_curve
>>> y_true = np.array([0, 0, 1, 1])
>>> y_scores = np.array([0.1, 0.4, 0.35, 0.8])
>>> fpr, fnr, thresholds = det_curve(y_true, y_scores)
>>> fpr
array([0.5, 0.5, 0. ])
>>> fnr
array([0. , 0.5, 0.5])
>>> thresholds
array([0.35, 0.4 , 0.8 ])