plot_tree#
- sklearn.tree.plot_tree(decision_tree, *, max_depth=None, feature_names=None, class_names=None, label='all', filled=False, impurity=True, node_ids=False, proportion=False, rounded=False, precision=3, ax=None, fontsize=None)[source]#
绘制决策树。
The sample counts that are shown are weighted with any sample_weights that might be present.
The visualization is fit automatically to the size of the axis. Use the
figsizeordpiarguments ofplt.figureto control the size of the rendering.更多信息请参阅 用户指南。
0.21 版本新增。
- 参数:
- decision_tree决策树回归器或分类器
要绘制的决策树。
- max_depthint, default=None
表示的最大深度。如果为None,则完整生成树。
- feature_namesarray-like of str, default=None
每个特征的名称。如果为None,将使用通用名称(“x[0]”,“x[1]”,…)。
- class_namesarray-like of str or True, default=None
每个目标类别的名称,按升序排列。仅与分类相关,不支持多输出。如果为
True,则显示类名的符号表示。- label{‘all’, ‘root’, ‘none’}, default=’all’
是否显示有关杂质等的有信息标签。选项包括‘all’(在每个节点显示)、‘root’(仅在顶部根节点显示)或‘none’(不在任何节点显示)。
- filledbool, default=False
设置为
True时,为分类节点填充颜色以指示多数类别,为回归节点填充颜色以指示值极端性,或为多输出节点填充颜色以指示节点纯度。- impuritybool, default=True
设置为
True时,显示每个节点的杂质。- node_idsbool, default=False
设置为
True时,显示每个节点的ID号。- proportionbool, default=False
设置为
True时,将“values”和/或“samples”的显示分别更改为比例和百分比。- roundedbool, default=False
设置为
True时,绘制圆角的节点框,并使用 Helvetica 字体代替 Times-Roman。- precisionint, default=3
每个节点的杂质、阈值和值属性中的浮点数精度位数。
- axmatplotlib axis, default=None
要绘制的轴。如果为None,则使用当前轴。任何以前的内容都会被清除。
- fontsizeint, default=None
文本字体大小。如果为None,则自动确定以适应图形。
- 返回:
- annotationslist of artists
包含构成树的注释框的 artists 列表。
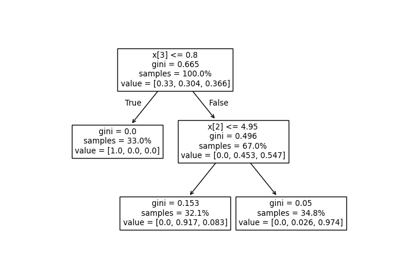
示例
>>> from sklearn.datasets import load_iris
>>> from sklearn import tree
>>> clf = tree.DecisionTreeClassifier(random_state=0)
>>> iris = load_iris()
>>> clf = clf.fit(iris.data, iris.target)
>>> tree.plot_tree(clf)
[...]