注意
转到结尾 下载完整的示例代码。或通过JupyterLite或Binder在您的浏览器中运行此示例
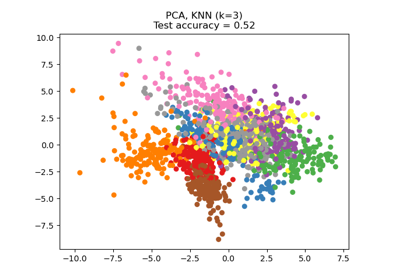
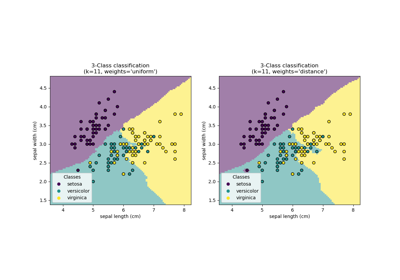
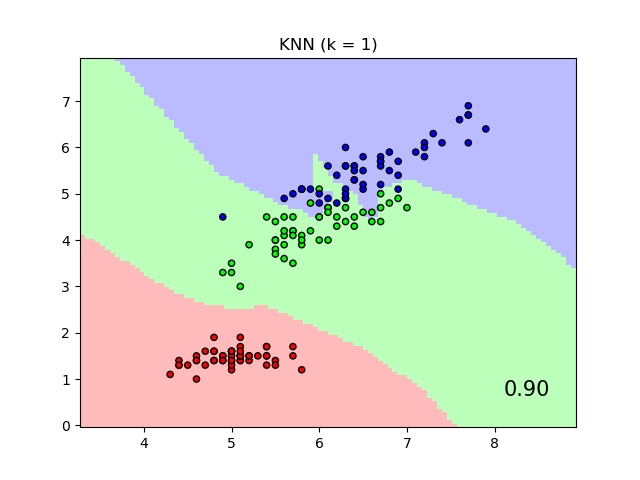
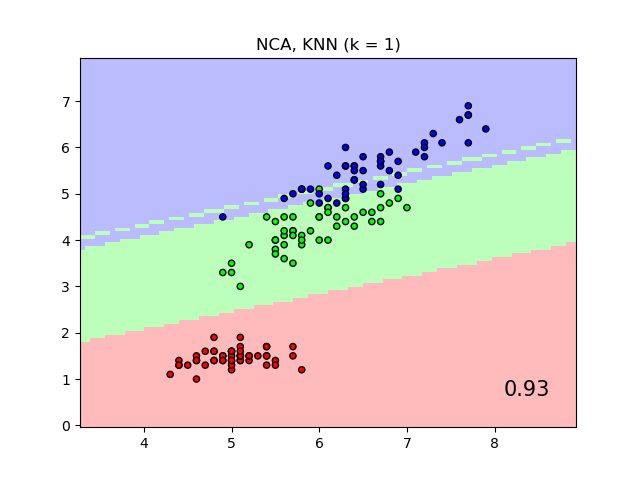
比较使用和不使用邻域成分分析的最近邻算法#
一个比较使用和不使用邻域成分分析的最近邻分类的例子。
它将绘制使用原始特征上的欧几里德距离与使用邻域成分分析学习到的变换后的欧几里德距离时,最近邻分类器给出的类决策边界。后者旨在找到一个线性变换,最大化训练集上的(随机)最近邻分类精度。
# Authors: The scikit-learn developers
# SPDX-License-Identifier: BSD-3-Clause

import matplotlib.pyplot as plt
from matplotlib.colors import ListedColormap

from sklearn import datasets
from sklearn.inspection import DecisionBoundaryDisplay
from sklearn.model_selection import train_test_split
from sklearn.neighbors import KNeighborsClassifier, NeighborhoodComponentsAnalysis
from sklearn.pipeline import Pipeline
from sklearn.preprocessing import StandardScaler

n_neighbors = 1

dataset = datasets.load_iris()
X, y = dataset.data, dataset.target

# we only take two features. We could avoid this ugly
# slicing by using a two-dim dataset
X = X[:, [0, 2]]

X_train, X_test, y_train, y_test = train_test_split(
    X, y, stratify=y, test_size=0.7, random_state=42
)

h = 0.05  # step size in the mesh

# Create color maps
cmap_light = ListedColormap(["#FFAAAA", "#AAFFAA", "#AAAAFF"])
cmap_bold = ListedColormap(["#FF0000", "#00FF00", "#0000FF"])

names = ["KNN", "NCA, KNN"]

classifiers = [
    Pipeline(
        [
            ("scaler", StandardScaler()),
            ("knn", KNeighborsClassifier(n_neighbors=n_neighbors)),
        ]
    ),
    Pipeline(
        [
            ("scaler", StandardScaler()),
            ("nca", NeighborhoodComponentsAnalysis()),
            ("knn", KNeighborsClassifier(n_neighbors=n_neighbors)),
        ]
    ),
]

for name, clf in zip(names, classifiers):
    clf.fit(X_train, y_train)
    score = clf.score(X_test, y_test)

    _, ax = plt.subplots()
    DecisionBoundaryDisplay.from_estimator(
        clf,
        X,
        cmap=cmap_light,
        alpha=0.8,
        ax=ax,
        response_method="predict",
        plot_method="pcolormesh",
        shading="auto",
    )

    # Plot also the training and testing points
    plt.scatter(X[:, 0], X[:, 1], c=y, cmap=cmap_bold, edgecolor="k", s=20)
    plt.title("{} (k = {})".format(name, n_neighbors))
    plt.text(
        0.9,
        0.1,
        "{:.2f}".format(score),
        size=15,
        ha="center",
        va="center",
        transform=plt.gca().transAxes,
    )

plt.show()
脚本总运行时间:(0分钟0.773秒)
相关示例