注意
转到末尾 下载完整示例代码,或通过 JupyterLite 或 Binder 在浏览器中运行此示例。
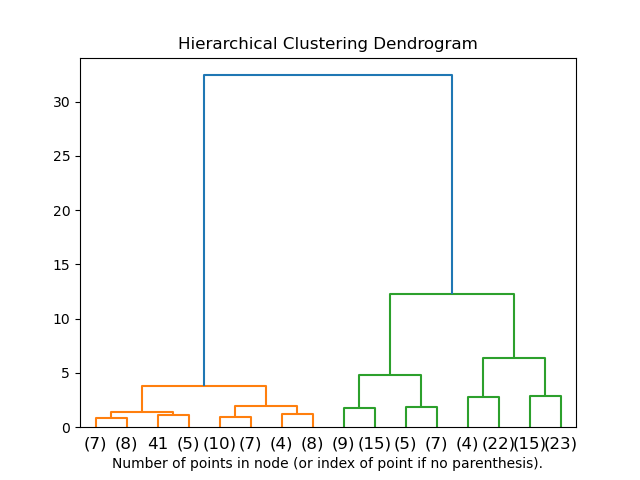
绘制层次聚类树状图#
这个示例使用 AgglomerativeClustering 和 scipy 中可用的 dendrogram 方法绘制了层次聚类的相应树状图。
import numpy as np
from matplotlib import pyplot as plt
from scipy.cluster.hierarchy import dendrogram

from sklearn.cluster import AgglomerativeClustering
from sklearn.datasets import load_iris


def plot_dendrogram(model, **kwargs):
    # Create linkage matrix and then plot the dendrogram

    # create the counts of samples under each node
    counts = np.zeros(model.children_.shape[0])
    n_samples = len(model.labels_)
    for i, merge in enumerate(model.children_):
        current_count = 0
        for child_idx in merge:
            if child_idx < n_samples:
                current_count += 1  # leaf node
            else:
                current_count += counts[child_idx - n_samples]
        counts[i] = current_count

    linkage_matrix = np.column_stack(
        [model.children_, model.distances_, counts]
    ).astype(float)

    # Plot the corresponding dendrogram
    dendrogram(linkage_matrix, **kwargs)


iris = load_iris()
X = iris.data

# setting distance_threshold=0 ensures we compute the full tree.
model = AgglomerativeClustering(distance_threshold=0, n_clusters=None)

model = model.fit(X)
plt.title("Hierarchical Clustering Dendrogram")
# plot the top three levels of the dendrogram
plot_dendrogram(model, truncate_mode="level", p=3)
plt.xlabel("Number of points in node (or index of point if no parenthesis).")
plt.show()
脚本总运行时间: (0 分钟 0.083 秒)
相关示例