注意
转到末尾以下载完整示例代码,或通过 JupyterLite 或 Binder 在浏览器中运行此示例
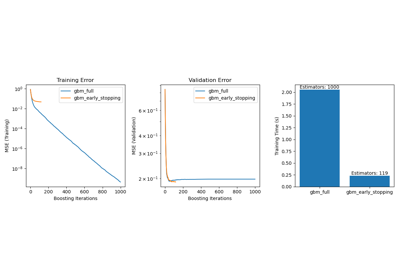
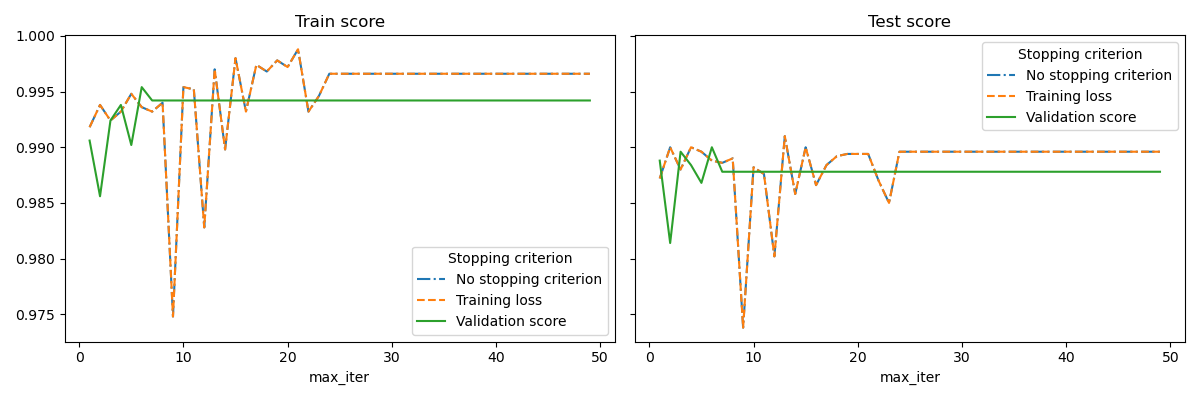
随机梯度下降的早期停止#
随机梯度下降是一种优化技术,以随机方式最小化损失函数,逐样本执行梯度下降步骤。特别是,它是一种非常有效地拟合线性模型的方法。
作为一种随机方法,损失函数不一定在每次迭代中都减小,收敛仅在期望上得到保证。因此,监测损失函数上的收敛可能很困难。
另一种方法是监测验证分数上的收敛。在这种情况下,输入数据被分为训练集和验证集。模型随后在训练集上拟合,停止准则基于在验证集上计算的预测分数。这使我们能够找到足够少的迭代次数,以构建一个对未见数据泛化良好并减少训练数据过拟合风险的模型。
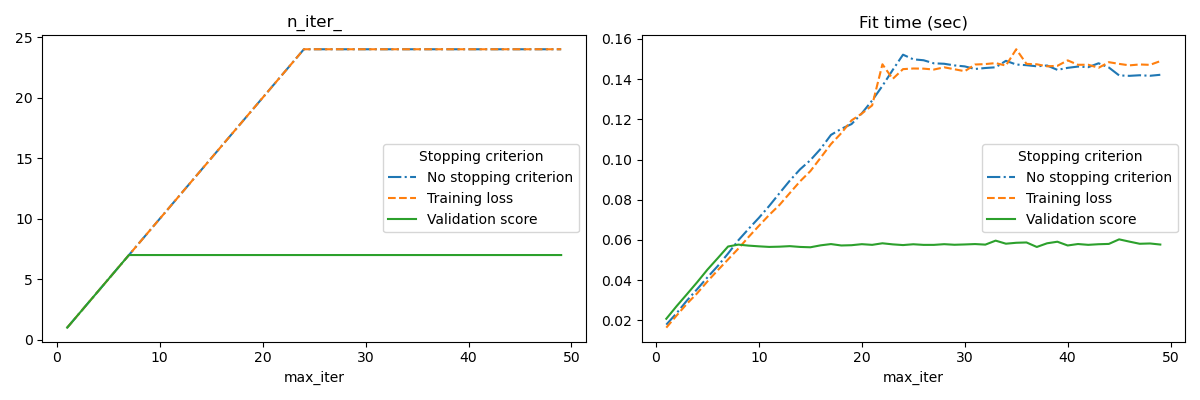
当 early_stopping=True 时,此早期停止策略被激活;否则,停止准则仅使用整个输入数据上的训练损失。为了更好地控制早期停止策略,我们可以指定一个参数 validation_fraction,它设置用于计算验证分数的输入数据集的比例。优化将继续,直到在最近 n_iter_no_change 次迭代中验证分数没有至少提高 tol。实际迭代次数可在属性 n_iter_ 中获取。
本示例说明了如何在 SGDClassifier 模型中使用早期停止,与不使用早期停止的模型相比,可以达到几乎相同的准确率。这可以显著减少训练时间。请注意,即使在早期迭代中,不同停止准则下的分数也会有所不同,因为在验证停止准则下,部分训练数据被保留用于验证。
No stopping criterion: .................................................
Training loss: .................................................
Validation score: .................................................
# Authors: The scikit-learn developers
# SPDX-License-Identifier: BSD-3-Clause

import sys
import time

import matplotlib.pyplot as plt
import numpy as np
import pandas as pd

from sklearn import linear_model
from sklearn.datasets import fetch_openml
from sklearn.exceptions import ConvergenceWarning
from sklearn.model_selection import train_test_split
from sklearn.utils import shuffle
from sklearn.utils._testing import ignore_warnings


def load_mnist(n_samples=None, class_0="0", class_1="8"):
    """Load MNIST, select two classes, shuffle and return only n_samples."""
    # Load data from http://openml.org/d/554
    mnist = fetch_openml("mnist_784", version=1, as_frame=False)

    # take only two classes for binary classification
    mask = np.logical_or(mnist.target == class_0, mnist.target == class_1)

    X, y = shuffle(mnist.data[mask], mnist.target[mask], random_state=42)
    if n_samples is not None:
        X, y = X[:n_samples], y[:n_samples]
    return X, y


@ignore_warnings(category=ConvergenceWarning)
def fit_and_score(estimator, max_iter, X_train, X_test, y_train, y_test):
    """Fit the estimator on the train set and score it on both sets"""
    estimator.set_params(max_iter=max_iter)
    estimator.set_params(random_state=0)

    start = time.time()
    estimator.fit(X_train, y_train)

    fit_time = time.time() - start
    n_iter = estimator.n_iter_
    train_score = estimator.score(X_train, y_train)
    test_score = estimator.score(X_test, y_test)

    return fit_time, n_iter, train_score, test_score


# Define the estimators to compare
estimator_dict = {
    "No stopping criterion": linear_model.SGDClassifier(n_iter_no_change=3),
    "Training loss": linear_model.SGDClassifier(
        early_stopping=False, n_iter_no_change=3, tol=0.1
    ),
    "Validation score": linear_model.SGDClassifier(
        early_stopping=True, n_iter_no_change=3, tol=0.0001, validation_fraction=0.2
    ),
}

# Load the dataset
X, y = load_mnist(n_samples=10000)
X_train, X_test, y_train, y_test = train_test_split(X, y, test_size=0.5, random_state=0)

results = []
for estimator_name, estimator in estimator_dict.items():
    print(estimator_name + ": ", end="")
    for max_iter in range(1, 50):
        print(".", end="")
        sys.stdout.flush()

        fit_time, n_iter, train_score, test_score = fit_and_score(
            estimator, max_iter, X_train, X_test, y_train, y_test
        )

        results.append(
            (estimator_name, max_iter, fit_time, n_iter, train_score, test_score)
        )
    print("")

# Transform the results in a pandas dataframe for easy plotting
columns = [
    "Stopping criterion",
    "max_iter",
    "Fit time (sec)",
    "n_iter_",
    "Train score",
    "Test score",
]
results_df = pd.DataFrame(results, columns=columns)

# Define what to plot
lines = "Stopping criterion"
x_axis = "max_iter"
styles = ["-.", "--", "-"]

# First plot: train and test scores
fig, axes = plt.subplots(nrows=1, ncols=2, sharey=True, figsize=(12, 4))
for ax, y_axis in zip(axes, ["Train score", "Test score"]):
    for style, (criterion, group_df) in zip(styles, results_df.groupby(lines)):
        group_df.plot(x=x_axis, y=y_axis, label=criterion, ax=ax, style=style)
    ax.set_title(y_axis)
    ax.legend(title=lines)
fig.tight_layout()

# Second plot: n_iter and fit time
fig, axes = plt.subplots(nrows=1, ncols=2, figsize=(12, 4))
for ax, y_axis in zip(axes, ["n_iter_", "Fit time (sec)"]):
    for style, (criterion, group_df) in zip(styles, results_df.groupby(lines)):
        group_df.plot(x=x_axis, y=y_axis, label=criterion, ax=ax, style=style)
    ax.set_title(y_axis)
    ax.legend(title=lines)
fig.tight_layout()

plt.show()
脚本总运行时间: (0 分 25.012 秒)
相关示例