注意
转到末尾以下载完整示例代码,或者通过 JupyterLite 或 Binder 在浏览器中运行此示例。
图像分割的谱聚类#
在此示例中,生成了一张带有连接圆圈的图像,并使用谱聚类来分离这些圆圈。
在这些设置中,谱聚类方法解决了被称为“归一化图割”的问题:图像被视为由连接体素组成的图,谱聚类算法相当于选择定义区域的图割,同时最小化沿割线的梯度比率和区域体积。
由于算法试图平衡体积(即平衡区域大小),如果我们采用不同大小的圆圈,分割将会失败。
此外,由于图像强度或其梯度中没有有用的信息,我们选择在仅受梯度微弱影响的图上执行谱聚类。这接近于对图进行 Voronoi 划分。
此外,我们使用对象的掩码将图限制在对象的轮廓上。在此示例中,我们感兴趣的是将对象彼此分离,而不是从背景中分离。
# Authors: The scikit-learn developers
# SPDX-License-Identifier: BSD-3-Clause
生成数据#
import numpy as np

l = 100
x, y = np.indices((l, l))

center1 = (28, 24)
center2 = (40, 50)
center3 = (67, 58)
center4 = (24, 70)

radius1, radius2, radius3, radius4 = 16, 14, 15, 14

circle1 = (x - center1[0]) ** 2 + (y - center1[1]) ** 2 < radius1**2
circle2 = (x - center2[0]) ** 2 + (y - center2[1]) ** 2 < radius2**2
circle3 = (x - center3[0]) ** 2 + (y - center3[1]) ** 2 < radius3**2
circle4 = (x - center4[0]) ** 2 + (y - center4[1]) ** 2 < radius4**2
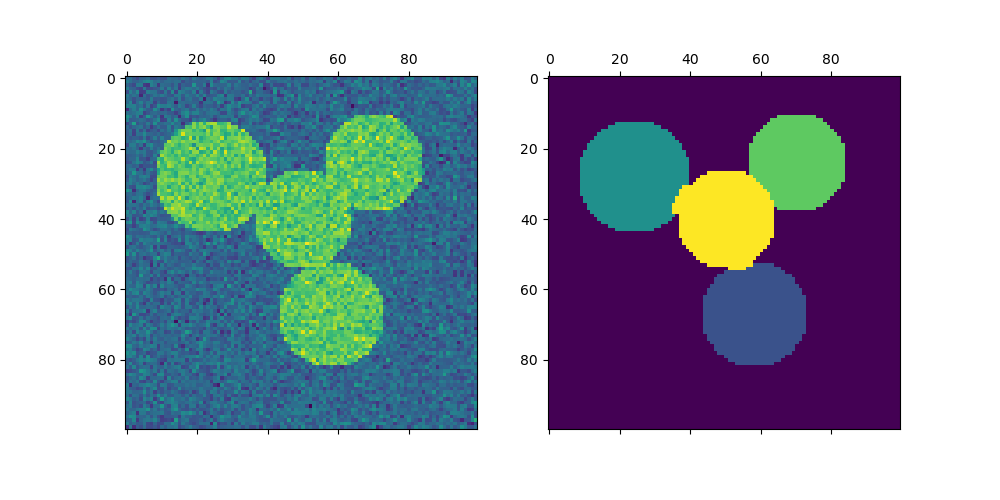
绘制四个圆圈#
img = circle1 + circle2 + circle3 + circle4

# We use a mask that limits to the foreground: the problem that we are
# interested in here is not separating the objects from the background,
# but separating them one from the other.
mask = img.astype(bool)

img = img.astype(float)
img += 1 + 0.2 * np.random.randn(*img.shape)
将图像转换为图,并在边上标注梯度值。
from sklearn.feature_extraction import image

graph = image.img_to_graph(img, mask=mask)
采用梯度的递减函数,实现接近 Voronoi 划分的分割。
graph.data = np.exp(-graph.data / graph.data.std())
在这里,我们使用 arpack 求解器进行谱聚类,因为在这个示例中 amg 在数值上不稳定。然后我们绘制结果。
import matplotlib.pyplot as plt

from sklearn.cluster import spectral_clustering

labels = spectral_clustering(graph, n_clusters=4, eigen_solver="arpack")
label_im = np.full(mask.shape, -1.0)
label_im[mask] = labels

fig, axs = plt.subplots(nrows=1, ncols=2, figsize=(10, 5))
axs[0].matshow(img)
axs[1].matshow(label_im)

plt.show()
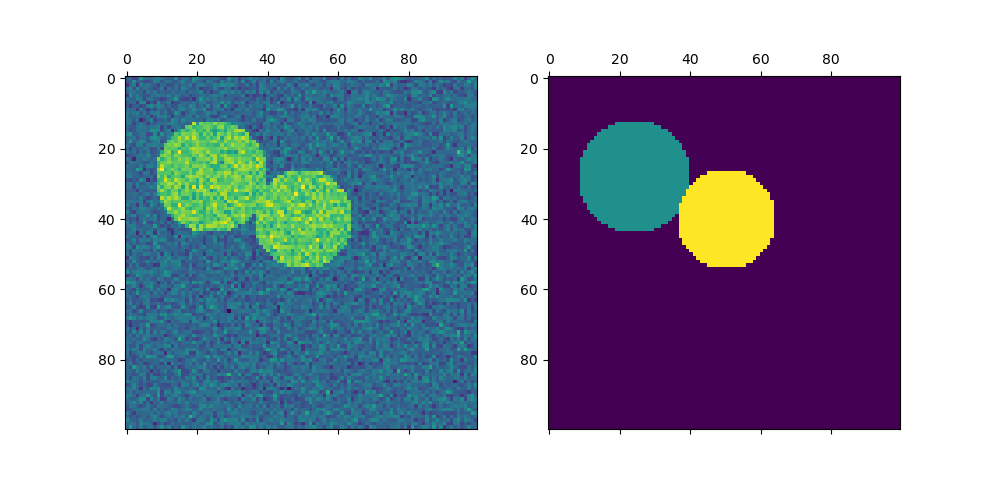
绘制两个圆圈#
在这里,我们重复上述过程,但只考虑我们生成的头两个圆圈。请注意,这会使圆圈之间的分离更清晰,因为在这种情况下区域大小更容易平衡。
img = circle1 + circle2
mask = img.astype(bool)
img = img.astype(float)

img += 1 + 0.2 * np.random.randn(*img.shape)

graph = image.img_to_graph(img, mask=mask)
graph.data = np.exp(-graph.data / graph.data.std())

labels = spectral_clustering(graph, n_clusters=2, eigen_solver="arpack")
label_im = np.full(mask.shape, -1.0)
label_im[mask] = labels

fig, axs = plt.subplots(nrows=1, ncols=2, figsize=(10, 5))
axs[0].matshow(img)
axs[1].matshow(label_im)

plt.show()
脚本总运行时间: (0 分 0.424 秒)
相关示例