注意
跳转到末尾 以下载完整的示例代码,或通过 JupyterLite 或 Binder 在浏览器中运行此示例。
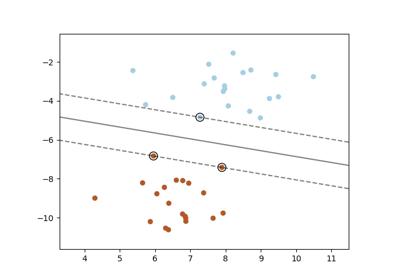
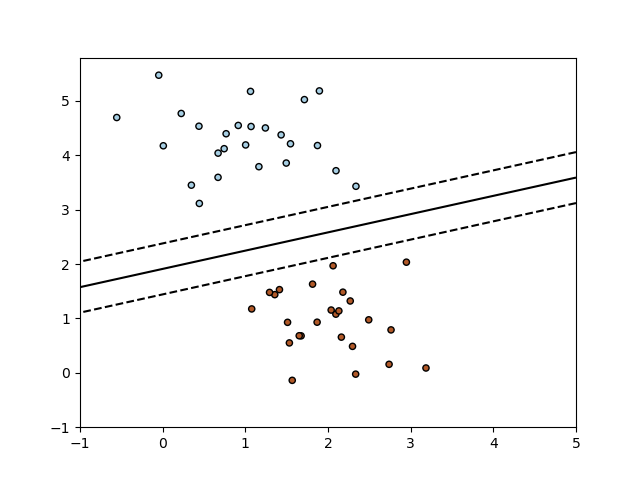
SGD: 最大间隔分离超平面#
使用 SGD 训练的线性支持向量机分类器,在两类可分离数据集中绘制最大间隔分离超平面。
# Authors: The scikit-learn developers
# SPDX-License-Identifier: BSD-3-Clause

import matplotlib.pyplot as plt
import numpy as np

from sklearn.datasets import make_blobs
from sklearn.linear_model import SGDClassifier

# we create 50 separable points
X, Y = make_blobs(n_samples=50, centers=2, random_state=0, cluster_std=0.60)

# fit the model
clf = SGDClassifier(loss="hinge", alpha=0.01, max_iter=200)

clf.fit(X, Y)

# plot the line, the points, and the nearest vectors to the plane
xx = np.linspace(-1, 5, 10)
yy = np.linspace(-1, 5, 10)

X1, X2 = np.meshgrid(xx, yy)
Z = np.empty(X1.shape)
for (i, j), val in np.ndenumerate(X1):
    x1 = val
    x2 = X2[i, j]
    p = clf.decision_function([[x1, x2]])
    Z[i, j] = p[0]
levels = [-1.0, 0.0, 1.0]
linestyles = ["dashed", "solid", "dashed"]
colors = "k"
plt.contour(X1, X2, Z, levels, colors=colors, linestyles=linestyles)
plt.scatter(X[:, 0], X[:, 1], c=Y, cmap=plt.cm.Paired, edgecolor="black", s=20)

plt.axis("tight")
plt.show()
脚本总运行时间: (0 分 0.069 秒)
相关示例