注意
前往末尾 下载完整示例代码,或通过 JupyterLite 或 Binder 在浏览器中运行此示例
比较 BIRCH 和 MiniBatchKMeans#
本示例比较了 BIRCH(有无全局聚类步骤)和 MiniBatchKMeans 在一个使用 make_blobs 生成的包含 25,000 个样本和 2 个特征的合成数据集上的耗时。
Both MiniBatchKMeans 和 BIRCH 都是高度可扩展的算法,可以在数十万甚至数百万数据点上高效运行。我们选择限制此示例的数据集大小,以保持持续集成资源使用的合理性,但感兴趣的读者可以尝试编辑此脚本,用更大的 n_samples 值重新运行。
如果将 n_clusters 设置为 None,数据将从 25,000 个样本减少到 158 个聚类。这可以被视为最终(全局)聚类步骤之前的预处理步骤,该步骤将这 158 个聚类进一步减少到 100 个聚类。
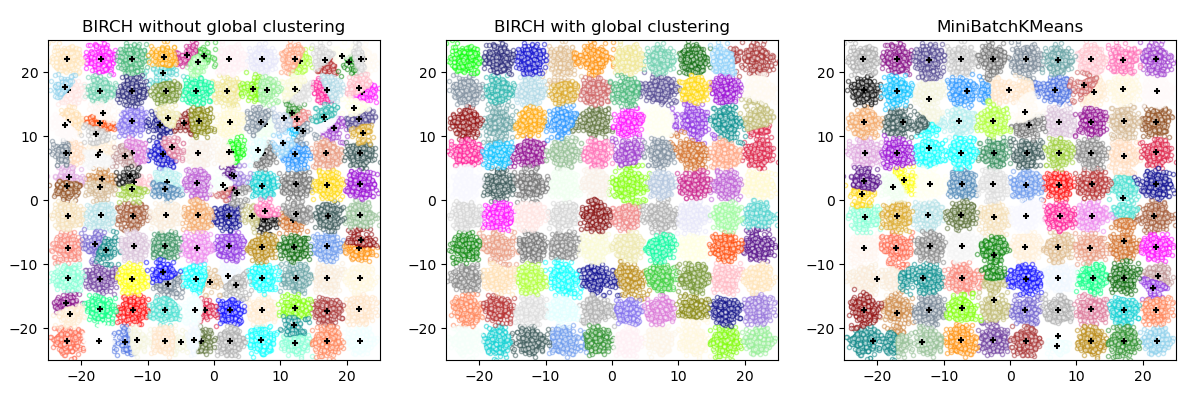
BIRCH without global clustering as the final step took 0.46 seconds
n_clusters : 158
BIRCH with global clustering as the final step took 0.49 seconds
n_clusters : 100
Time taken to run MiniBatchKMeans 0.21 seconds
# Authors: The scikit-learn developers
# SPDX-License-Identifier: BSD-3-Clause

from itertools import cycle
from time import time

import matplotlib.colors as colors
import matplotlib.pyplot as plt
import numpy as np
from joblib import cpu_count

from sklearn.cluster import Birch, MiniBatchKMeans
from sklearn.datasets import make_blobs

# Generate centers for the blobs so that it forms a 10 X 10 grid.
xx = np.linspace(-22, 22, 10)
yy = np.linspace(-22, 22, 10)
xx, yy = np.meshgrid(xx, yy)
n_centers = np.hstack((np.ravel(xx)[:, np.newaxis], np.ravel(yy)[:, np.newaxis]))

# Generate blobs to do a comparison between MiniBatchKMeans and BIRCH.
X, y = make_blobs(n_samples=25000, centers=n_centers, random_state=0)

# Use all colors that matplotlib provides by default.
colors_ = cycle(colors.cnames.keys())

fig = plt.figure(figsize=(12, 4))
fig.subplots_adjust(left=0.04, right=0.98, bottom=0.1, top=0.9)

# Compute clustering with BIRCH with and without the final clustering step
# and plot.
birch_models = [
    Birch(threshold=1.7, n_clusters=None),
    Birch(threshold=1.7, n_clusters=100),
]
final_step = ["without global clustering", "with global clustering"]

for ind, (birch_model, info) in enumerate(zip(birch_models, final_step)):
    t = time()
    birch_model.fit(X)
    print("BIRCH %s as the final step took %0.2f seconds" % (info, (time() - t)))

    # Plot result
    labels = birch_model.labels_
    centroids = birch_model.subcluster_centers_
    n_clusters = np.unique(labels).size
    print("n_clusters : %d" % n_clusters)

    ax = fig.add_subplot(1, 3, ind + 1)
    for this_centroid, k, col in zip(centroids, range(n_clusters), colors_):
        mask = labels == k
        ax.scatter(X[mask, 0], X[mask, 1], c="w", edgecolor=col, marker=".", alpha=0.5)
        if birch_model.n_clusters is None:
            ax.scatter(this_centroid[0], this_centroid[1], marker="+", c="k", s=25)
    ax.set_ylim([-25, 25])
    ax.set_xlim([-25, 25])
    ax.set_autoscaley_on(False)
    ax.set_title("BIRCH %s" % info)

# Compute clustering with MiniBatchKMeans.
mbk = MiniBatchKMeans(
    init="k-means++",
    n_clusters=100,
    batch_size=256 * cpu_count(),
    n_init=10,
    max_no_improvement=10,
    verbose=0,
    random_state=0,
)
t0 = time()
mbk.fit(X)
t_mini_batch = time() - t0
print("Time taken to run MiniBatchKMeans %0.2f seconds" % t_mini_batch)
mbk_means_labels_unique = np.unique(mbk.labels_)

ax = fig.add_subplot(1, 3, 3)
for this_centroid, k, col in zip(mbk.cluster_centers_, range(n_clusters), colors_):
    mask = mbk.labels_ == k
    ax.scatter(X[mask, 0], X[mask, 1], marker=".", c="w", edgecolor=col, alpha=0.5)
    ax.scatter(this_centroid[0], this_centroid[1], marker="+", c="k", s=25)
ax.set_xlim([-25, 25])
ax.set_ylim([-25, 25])
ax.set_title("MiniBatchKMeans")
ax.set_autoscaley_on(False)
plt.show()
脚本总运行时间:(0 分 3.381 秒)
相关示例