注意
转到末尾以下载完整示例代码,或通过 JupyterLite 或 Binder 在浏览器中运行此示例。
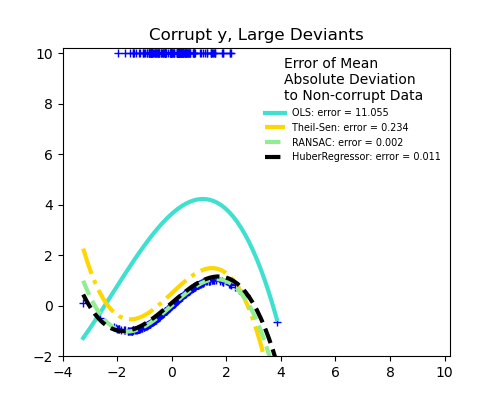
稳健线性估计器拟合#
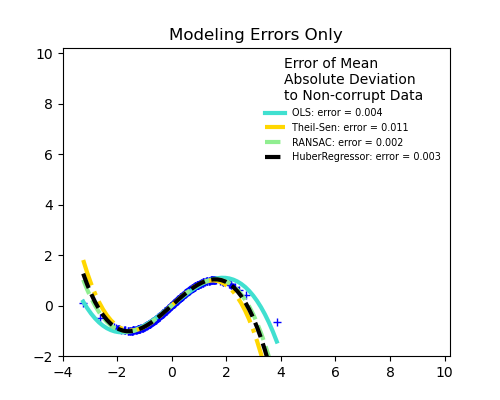
这里使用 3 阶多项式拟合接近零处的正弦函数。
在不同情况下演示稳健拟合
没有测量误差,只有建模误差(使用多项式拟合正弦函数)
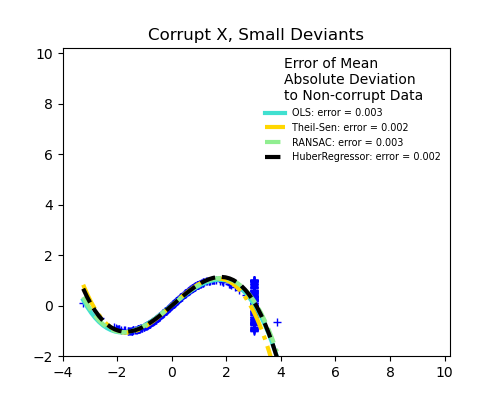
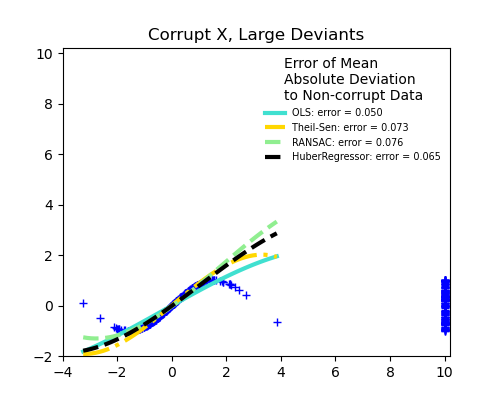
X 中的测量误差
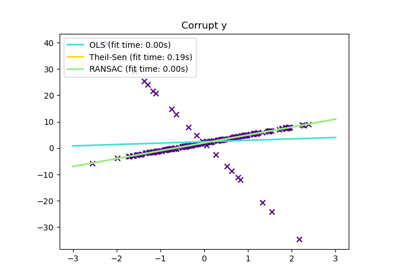
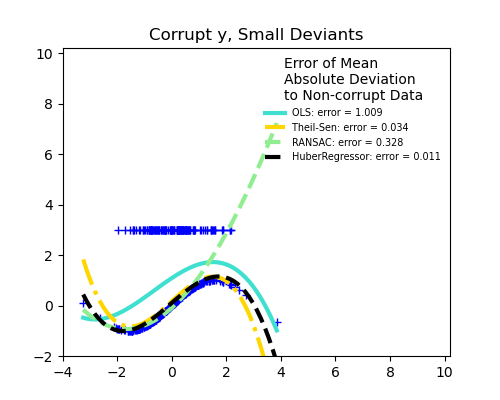
y 中的测量误差
使用中位数绝对偏差与未受污染的新数据来判断预测质量。
我们可以看到
RANSAC 适用于 y 方向上的强离群值
TheilSen 适用于 X 和 y 方向上的小离群值,但它有一个断点,超过该断点后,其性能比 OLS 差。
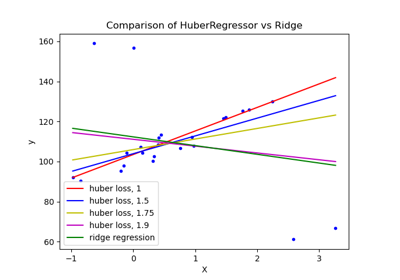
HuberRegressor 的分数不能直接与 TheilSen 和 RANSAC 进行比较,因为它不试图完全过滤离群值,而是减轻它们的影响。
# Authors: The scikit-learn developers
# SPDX-License-Identifier: BSD-3-Clause

import numpy as np
from matplotlib import pyplot as plt

from sklearn.linear_model import (
    HuberRegressor,
    LinearRegression,
    RANSACRegressor,
    TheilSenRegressor,
)
from sklearn.metrics import mean_squared_error
from sklearn.pipeline import make_pipeline
from sklearn.preprocessing import PolynomialFeatures

np.random.seed(42)

X = np.random.normal(size=400)
y = np.sin(X)
# Make sure that it X is 2D
X = X[:, np.newaxis]

X_test = np.random.normal(size=200)
y_test = np.sin(X_test)
X_test = X_test[:, np.newaxis]

y_errors = y.copy()
y_errors[::3] = 3

X_errors = X.copy()
X_errors[::3] = 3

y_errors_large = y.copy()
y_errors_large[::3] = 10

X_errors_large = X.copy()
X_errors_large[::3] = 10

estimators = [
    ("OLS", LinearRegression()),
    ("Theil-Sen", TheilSenRegressor(random_state=42)),
    ("RANSAC", RANSACRegressor(random_state=42)),
    ("HuberRegressor", HuberRegressor()),
]
colors = {
    "OLS": "turquoise",
    "Theil-Sen": "gold",
    "RANSAC": "lightgreen",
    "HuberRegressor": "black",
}
linestyle = {"OLS": "-", "Theil-Sen": "-.", "RANSAC": "--", "HuberRegressor": "--"}
lw = 3

x_plot = np.linspace(X.min(), X.max())
for title, this_X, this_y in [
    ("Modeling Errors Only", X, y),
    ("Corrupt X, Small Deviants", X_errors, y),
    ("Corrupt y, Small Deviants", X, y_errors),
    ("Corrupt X, Large Deviants", X_errors_large, y),
    ("Corrupt y, Large Deviants", X, y_errors_large),
]:
    plt.figure(figsize=(5, 4))
    plt.plot(this_X[:, 0], this_y, "b+")

    for name, estimator in estimators:
        model = make_pipeline(PolynomialFeatures(3), estimator)
        model.fit(this_X, this_y)
        mse = mean_squared_error(model.predict(X_test), y_test)
        y_plot = model.predict(x_plot[:, np.newaxis])
        plt.plot(
            x_plot,
            y_plot,
            color=colors[name],
            linestyle=linestyle[name],
            linewidth=lw,
            label="%s: error = %.3f" % (name, mse),
        )

    legend_title = "Error of Mean\nAbsolute Deviation\nto Non-corrupt Data"
    legend = plt.legend(
        loc="upper right", frameon=False, title=legend_title, prop=dict(size="x-small")
    )
    plt.xlim(-4, 10.2)
    plt.ylim(-2, 10.2)
    plt.title(title)
plt.show()
脚本总运行时间: (0 分钟 1.891 秒)
相关示例