注意
转到末尾以下载完整示例代码,或通过 JupyterLite 或 Binder 在浏览器中运行此示例。
随机梯度下降的早期停止#
随机梯度下降是一种优化技术,它以随机方式最小化损失函数,逐个样本执行梯度下降步骤。特别是,它是拟合线性模型的一种非常有效的方法。
作为一种随机方法,损失函数不一定在每次迭代中都减小,并且收敛仅在期望上得到保证。因此,监控损失函数上的收敛性可能很困难。
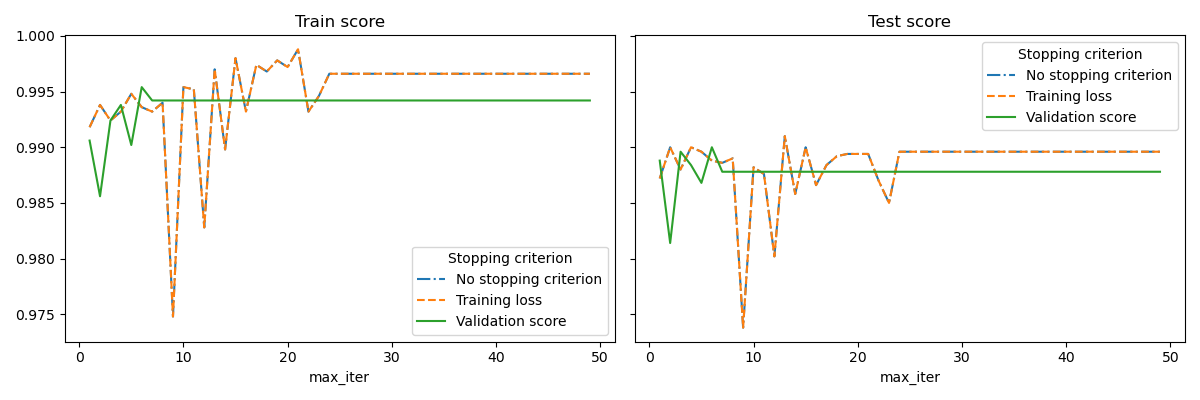
另一种方法是监控验证分数上的收敛性。在这种情况下,输入数据被分成训练集和验证集。然后模型在训练集上进行拟合,停止准则基于在验证集上计算的预测分数。这使我们能够找到最少的迭代次数,这些迭代次数足以构建一个能很好地泛化到未见数据的模型,并减少对训练数据过拟合的机会。
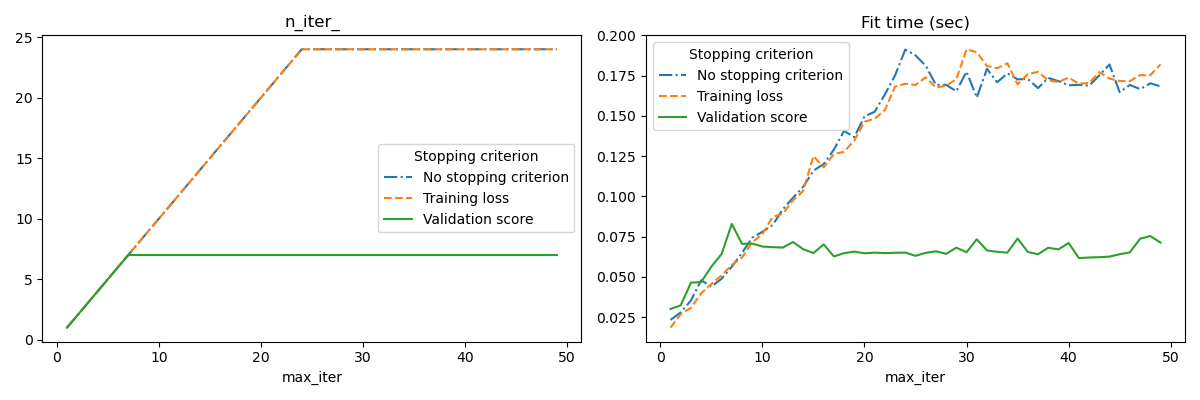
如果 early_stopping=True,则激活此早期停止策略;否则,停止准则仅使用整个输入数据上的训练损失。为了更好地控制早期停止策略,我们可以指定一个参数 validation_fraction,该参数设置我们留出来计算验证分数的输入数据集的比例。优化将继续进行,直到在最近的 n_iter_no_change 次迭代中,验证分数没有提高至少 tol。实际的迭代次数可在属性 n_iter_ 中找到。
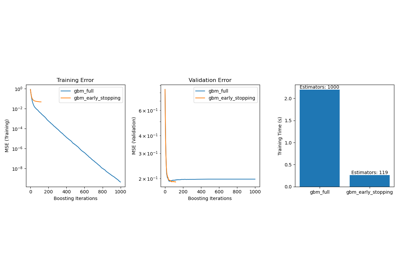
此示例说明了如何在 SGDClassifier 模型中使用早期停止来获得与没有早期停止的模型几乎相同的准确性。这可以显著减少训练时间。请注意,即使从早期迭代开始,停止准则之间的分数也会有所不同,因为在使用验证停止准则时,部分训练数据被保留下来。
No stopping criterion: .................................................
Training loss: .................................................
Validation score: .................................................
# Authors: The scikit-learn developers
# SPDX-License-Identifier: BSD-3-Clause

import sys
import time

import matplotlib.pyplot as plt
import numpy as np
import pandas as pd

from sklearn import linear_model
from sklearn.datasets import fetch_openml
from sklearn.exceptions import ConvergenceWarning
from sklearn.model_selection import train_test_split
from sklearn.utils import shuffle
from sklearn.utils._testing import ignore_warnings


def load_mnist(n_samples=None, class_0="0", class_1="8"):
    """Load MNIST, select two classes, shuffle and return only n_samples."""
    # Load data from http://openml.org/d/554
    mnist = fetch_openml("mnist_784", version=1, as_frame=False)

    # take only two classes for binary classification
    mask = np.logical_or(mnist.target == class_0, mnist.target == class_1)

    X, y = shuffle(mnist.data[mask], mnist.target[mask], random_state=42)
    if n_samples is not None:
        X, y = X[:n_samples], y[:n_samples]
    return X, y


@ignore_warnings(category=ConvergenceWarning)
def fit_and_score(estimator, max_iter, X_train, X_test, y_train, y_test):
    """Fit the estimator on the train set and score it on both sets"""
    estimator.set_params(max_iter=max_iter)
    estimator.set_params(random_state=0)

    start = time.time()
    estimator.fit(X_train, y_train)

    fit_time = time.time() - start
    n_iter = estimator.n_iter_
    train_score = estimator.score(X_train, y_train)
    test_score = estimator.score(X_test, y_test)

    return fit_time, n_iter, train_score, test_score


# Define the estimators to compare
estimator_dict = {
    "No stopping criterion": linear_model.SGDClassifier(n_iter_no_change=3),
    "Training loss": linear_model.SGDClassifier(
        early_stopping=False, n_iter_no_change=3, tol=0.1
    ),
    "Validation score": linear_model.SGDClassifier(
        early_stopping=True, n_iter_no_change=3, tol=0.0001, validation_fraction=0.2
    ),
}

# Load the dataset
X, y = load_mnist(n_samples=10000)
X_train, X_test, y_train, y_test = train_test_split(X, y, test_size=0.5, random_state=0)

results = []
for estimator_name, estimator in estimator_dict.items():
    print(estimator_name + ": ", end="")
    for max_iter in range(1, 50):
        print(".", end="")
        sys.stdout.flush()

        fit_time, n_iter, train_score, test_score = fit_and_score(
            estimator, max_iter, X_train, X_test, y_train, y_test
        )

        results.append(
            (estimator_name, max_iter, fit_time, n_iter, train_score, test_score)
        )
    print("")

# Transform the results in a pandas dataframe for easy plotting
columns = [
    "Stopping criterion",
    "max_iter",
    "Fit time (sec)",
    "n_iter_",
    "Train score",
    "Test score",
]
results_df = pd.DataFrame(results, columns=columns)

# Define what to plot
lines = "Stopping criterion"
x_axis = "max_iter"
styles = ["-.", "--", "-"]

# First plot: train and test scores
fig, axes = plt.subplots(nrows=1, ncols=2, sharey=True, figsize=(12, 4))
for ax, y_axis in zip(axes, ["Train score", "Test score"]):
    for style, (criterion, group_df) in zip(styles, results_df.groupby(lines)):
        group_df.plot(x=x_axis, y=y_axis, label=criterion, ax=ax, style=style)
    ax.set_title(y_axis)
    ax.legend(title=lines)
fig.tight_layout()

# Second plot: n_iter and fit time
fig, axes = plt.subplots(nrows=1, ncols=2, figsize=(12, 4))
for ax, y_axis in zip(axes, ["n_iter_", "Fit time (sec)"]):
    for style, (criterion, group_df) in zip(styles, results_df.groupby(lines)):
        group_df.plot(x=x_axis, y=y_axis, label=criterion, ax=ax, style=style)
    ax.set_title(y_axis)
    ax.legend(title=lines)
fig.tight_layout()

plt.show()
脚本总运行时间: (0 minutes 28.933 seconds)
相关示例