注意
转到末尾以下载完整示例代码或通过 JupyterLite 或 Binder 在浏览器中运行此示例。
单变量特征选择#
此笔记本是一个示例,展示如何使用单变量特征选择来提高嘈杂数据集上的分类精度。
在此示例中,向 iris 数据集添加了一些嘈杂(非信息性)特征。使用支持向量机 (SVM) 在应用单变量特征选择之前和之后对数据集进行分类。对于每个特征,我们绘制单变量特征选择的 p 值以及 SVM 的相应权重。通过这种方式,我们将比较模型精度并检查单变量特征选择对模型权重的影响。
# Authors: The scikit-learn developers
# SPDX-License-Identifier: BSD-3-Clause
生成样本数据#
import numpy as np

from sklearn.datasets import load_iris
from sklearn.model_selection import train_test_split

# The iris dataset
X, y = load_iris(return_X_y=True)

# Some noisy data not correlated
E = np.random.RandomState(42).uniform(0, 0.1, size=(X.shape[0], 20))

# Add the noisy data to the informative features
X = np.hstack((X, E))

# Split dataset to select feature and evaluate the classifier
X_train, X_test, y_train, y_test = train_test_split(X, y, stratify=y, random_state=0)
单变量特征选择#
使用 F 检验进行单变量特征选择以对特征评分。我们使用默认的选择函数来选择四个最显著的特征。
from sklearn.feature_selection import SelectKBest, f_classif

selector = SelectKBest(f_classif, k=4)
selector.fit(X_train, y_train)
scores = -np.log10(selector.pvalues_)
scores /= scores.max()
import matplotlib.pyplot as plt

X_indices = np.arange(X.shape[-1])
plt.figure(1)
plt.clf()
plt.bar(X_indices - 0.05, scores, width=0.2)
plt.title("Feature univariate score")
plt.xlabel("Feature number")
plt.ylabel(r"Univariate score ($-Log(p_{value})$)")
plt.show()
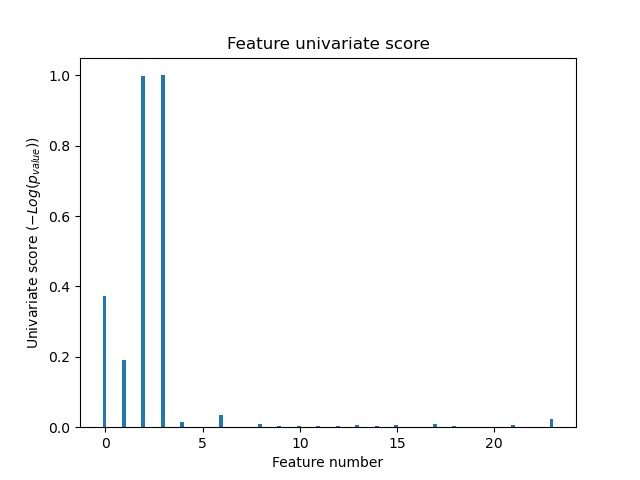
在特征总集中,只有 4 个原始特征是显著的。我们可以看到它们在单变量特征选择中得分最高。
与 SVM 进行比较#
不使用单变量特征选择
from sklearn.pipeline import make_pipeline
from sklearn.preprocessing import MinMaxScaler
from sklearn.svm import LinearSVC

clf = make_pipeline(MinMaxScaler(), LinearSVC())
clf.fit(X_train, y_train)
print(
    "Classification accuracy without selecting features: {:.3f}".format(
        clf.score(X_test, y_test)
    )
)

svm_weights = np.abs(clf[-1].coef_).sum(axis=0)
svm_weights /= svm_weights.sum()
Classification accuracy without selecting features: 0.789
应用单变量特征选择后
clf_selected = make_pipeline(SelectKBest(f_classif, k=4), MinMaxScaler(), LinearSVC())
clf_selected.fit(X_train, y_train)
print(
    "Classification accuracy after univariate feature selection: {:.3f}".format(
        clf_selected.score(X_test, y_test)
    )
)

svm_weights_selected = np.abs(clf_selected[-1].coef_).sum(axis=0)
svm_weights_selected /= svm_weights_selected.sum()
Classification accuracy after univariate feature selection: 0.868
plt.bar(
    X_indices - 0.45, scores, width=0.2, label=r"Univariate score ($-Log(p_{value})$)"
)

plt.bar(X_indices - 0.25, svm_weights, width=0.2, label="SVM weight")

plt.bar(
    X_indices[selector.get_support()] - 0.05,
    svm_weights_selected,
    width=0.2,
    label="SVM weights after selection",
)

plt.title("Comparing feature selection")
plt.xlabel("Feature number")
plt.yticks(())
plt.axis("tight")
plt.legend(loc="upper right")
plt.show()
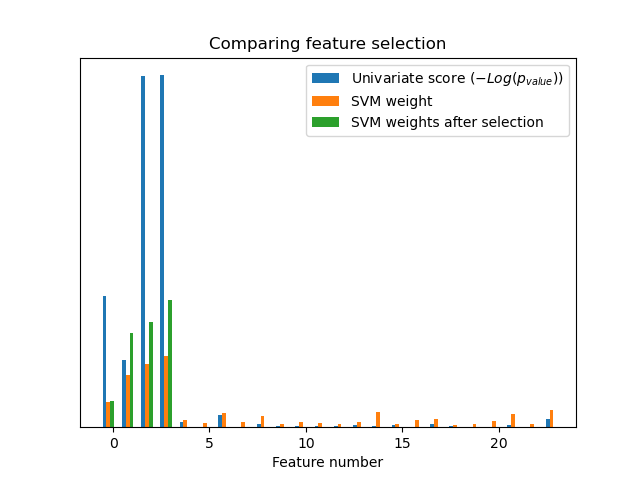
如果不使用单变量特征选择,SVM 会为前 4 个原始显著特征分配较大的权重,但也会选择许多非信息性特征。在 SVM 之前应用单变量特征选择会增加 SVM 赋予显著特征的权重,从而提高分类精度。
脚本总运行时间: (0 minutes 0.148 seconds)
相关示例